The way we build software keeps changing, and not in a way that ever settles. Models get better every few weeks. Harnesses ship new features faster than you can read the release notes. For any developer using AI seriously, this turns into a min-max problem: how much of your time goes into doing the work with the tools you already know, and how much goes into figuring out whether your workflow is actually any good?
It is not a clean trade-off either. Pick up a technique today and it might be useless in six months. Ignore a capability and you might be leaving hours a week on the table. Most of the advice floating around does not help much because people work on wildly different things, and a trick that is gold for a data scientist can actively hurt someone shipping a production service.
The conversation I keep seeing is mostly token maximalism. How many parallel agents are you running? How many tokens did you consume today? The quieter questions are the more interesting ones. Am I using the right model for this task? Are my context files stale? Do I keep re-explaining the same thing because I never wrote a skill file? When I look at my own week, am I actually getting better at this, or just busier?
I had been ignoring all of that. I was reading about other people’s workflows instead of looking at my own data.
Looking at the data
So Sanjay Singh, Tamas Boncz, and I built AI Engineer Coach, an open-source VS Code extension that scans the session logs already sitting on your machine and turns them into something you can reason about. It works with VSCode’s local agent, Claude coding agent, Codex coding agent, OpenCode, and GitHub Copilot CLI.
When I ran it on my own data, the picture was uncomfortable:
- 73% of my requests had no file references attached. Instead of making surgical, focused changes against a specific file, I was leaving the agent to go hunt for context on its own.
- 86% of the requests where I had set a reasoning effort were running at
highormax. Most of those were renames, format fixes, and one-line questions. Most AI labs recommendmediumfor typical work and reservinghighfor genuinely hard reasoning. - My most active workspace had no instruction file. I was building an AI tool without giving the AI any context about how to work on it.
- And the one that made me laugh: 39% of my requests happened on weekends.
None of those were the metrics I had been thinking about. Meanwhile they were sitting right there in my own logs.
🌟 View on GitHub (600+ stars and growing)
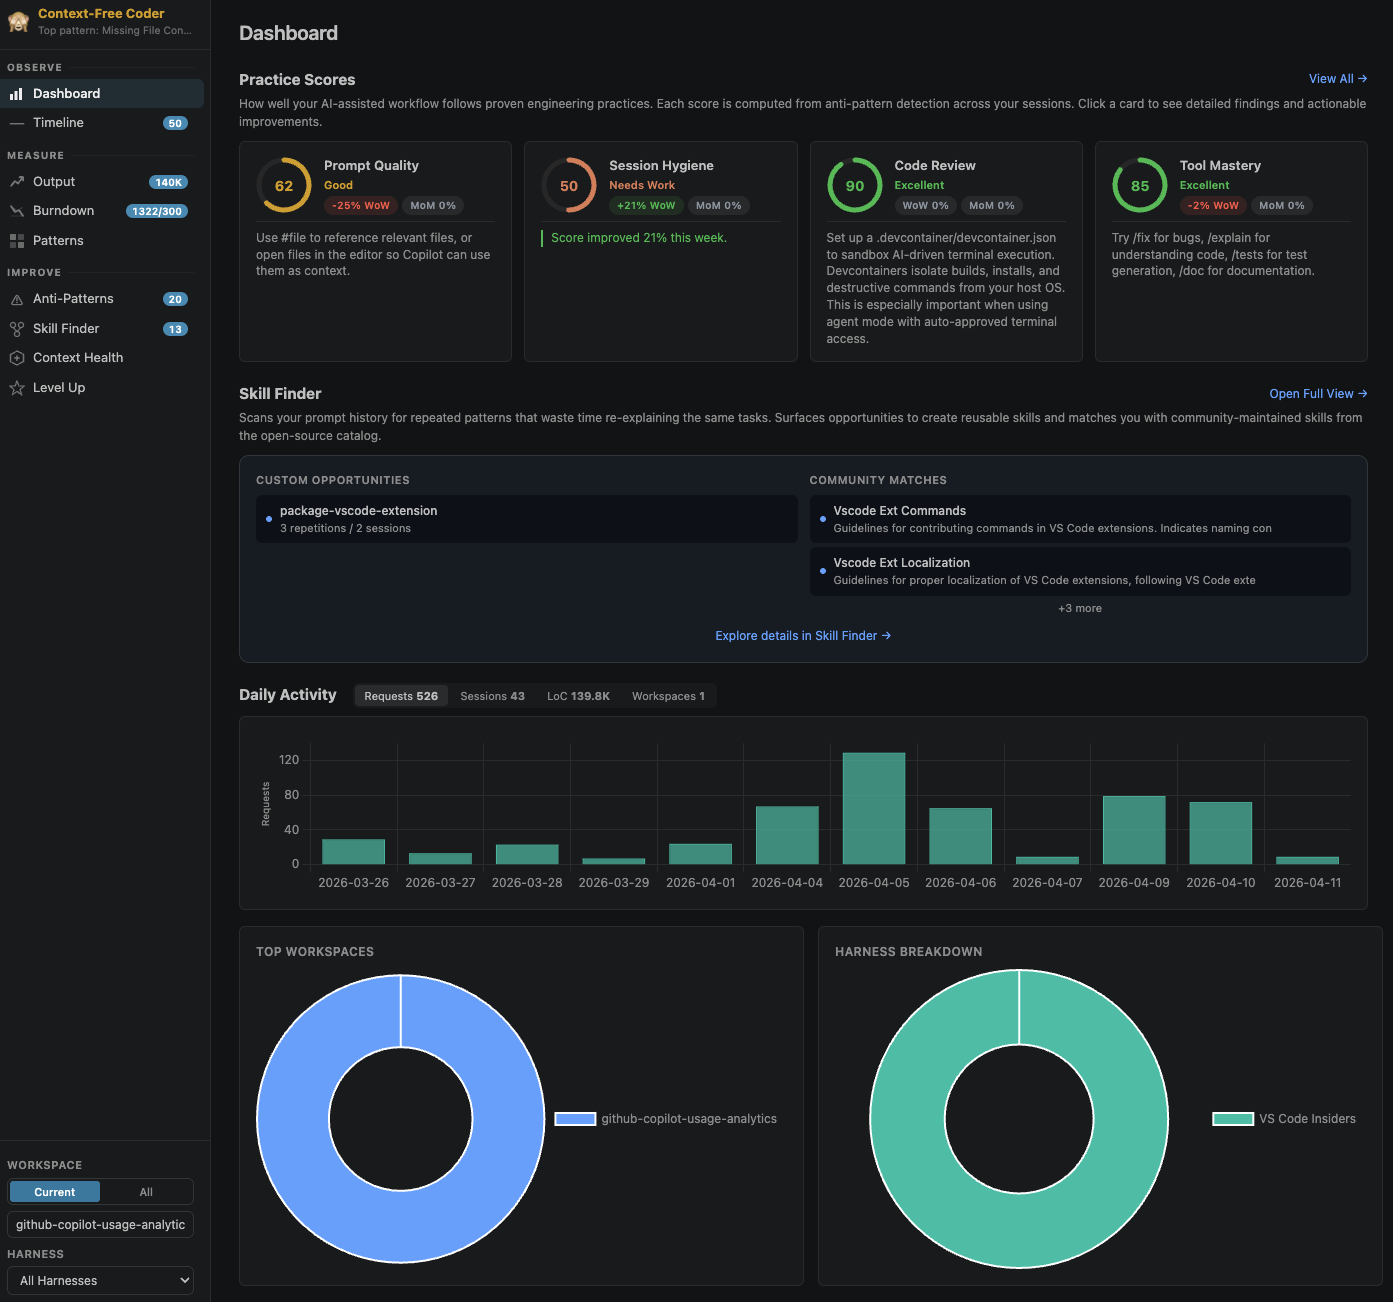
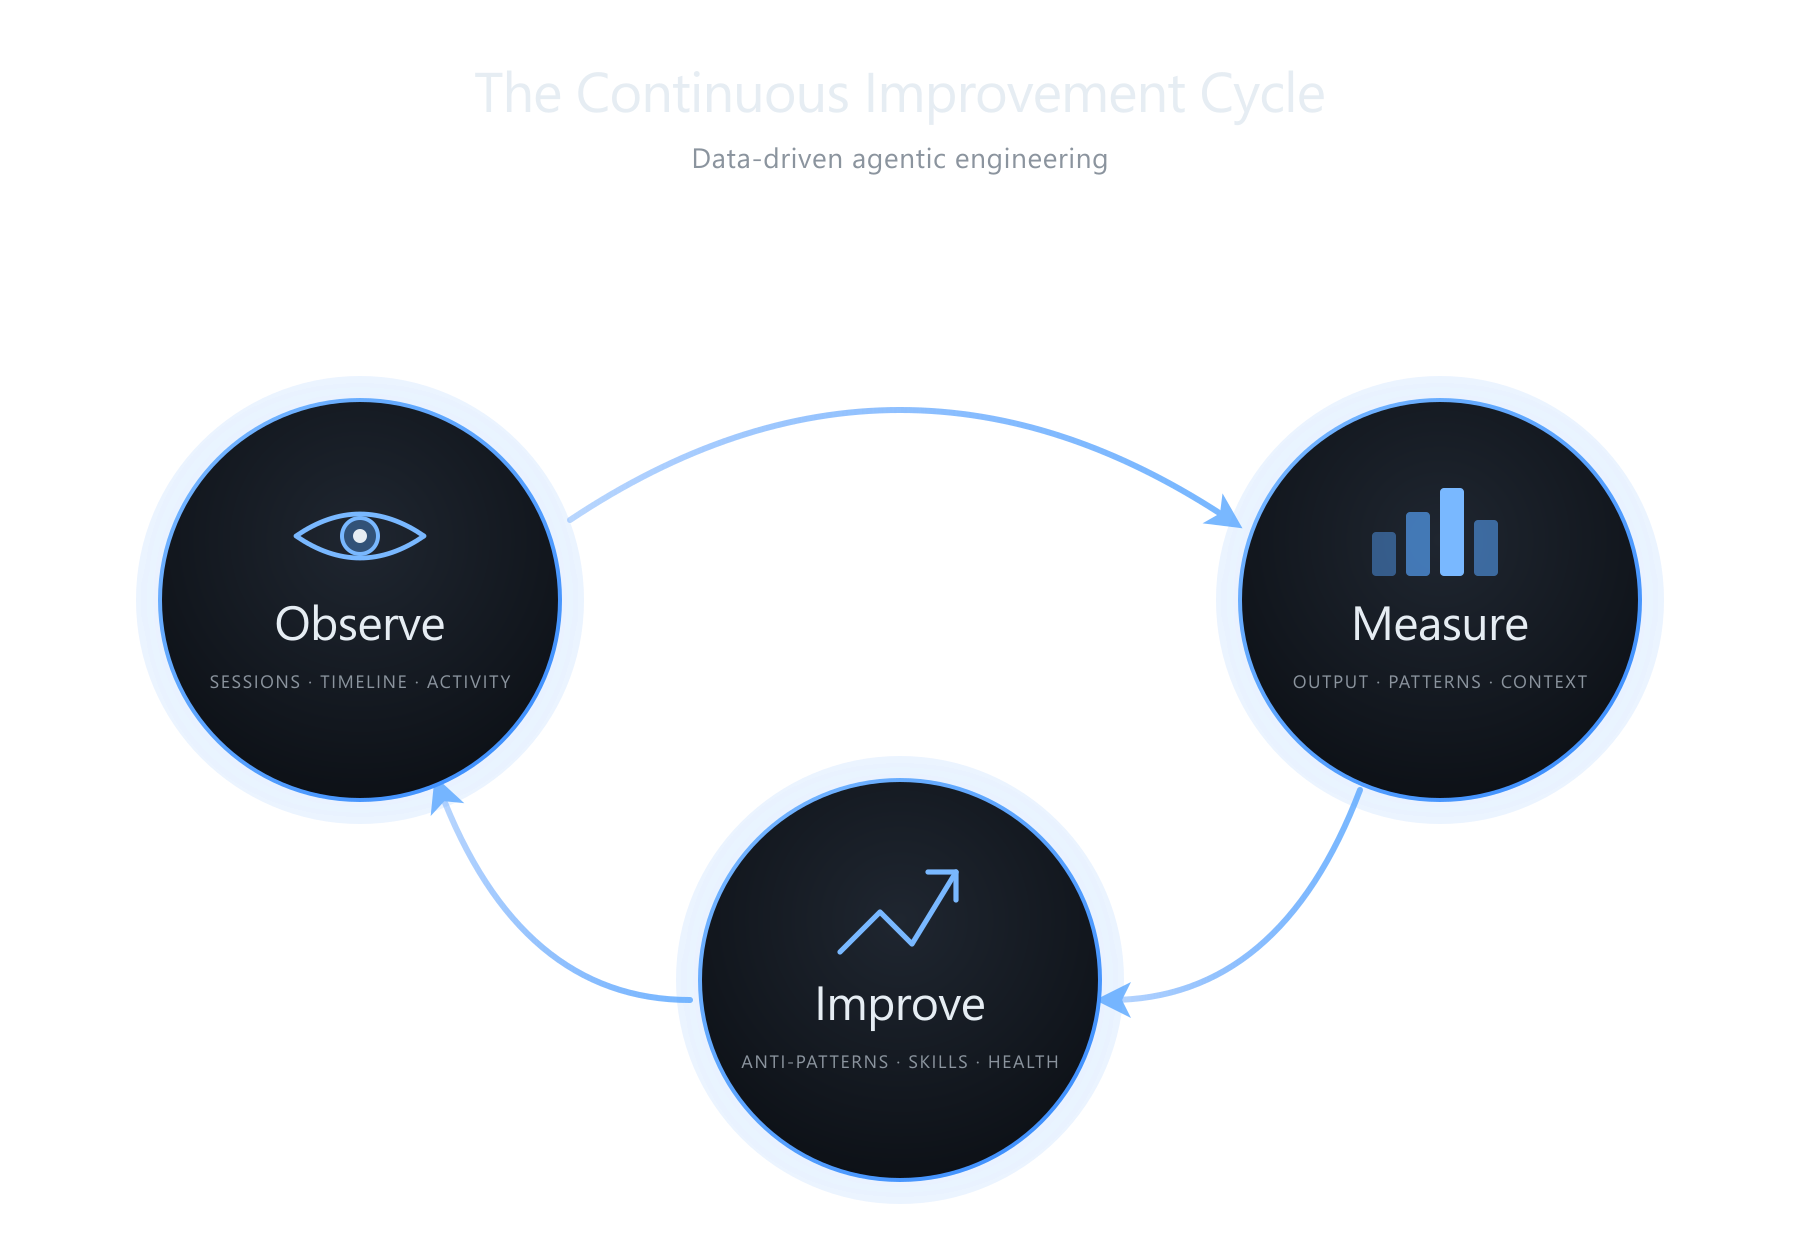
Observe, Measure, Improve
The extension is organized around three areas.
Observe is about your work mode. The headline view is a timeline that renders your sessions as a Gantt chart. The reason that matters: if you are troubleshooting a subtle bug, you probably want one focused session with your full attention on it. The model is not the bottleneck there, your head is. If you have ten microservices that need a version bump and an integration test, you can and should parallelize. The view tells you whether your work mode matched the complexity of what you were actually doing. There is also a Coding Moments page that stitches together screenshots from past sessions into short reels. It is pure fun, but watching an app evolve frame by frame is weirdly satisfying.
Measure is code production by language, workspace, model, and harness, plus a 7×24 heatmap of when you actually use AI. Lines of code is not a productivity metric and I do not think anyone should optimize for it. As a long-horizon comparison, “what was I shipping two years ago versus this month”, it is a useful proxy you can glance at without getting too attached. The heatmap is where I noticed something about myself. AI tools have a fear-of-missing-out quality, where you feel like there should be an agent running at all times or you are falling behind. Seeing it on a 7×24 grid makes that visible in a way nothing else does.
Improve is the part I use most.
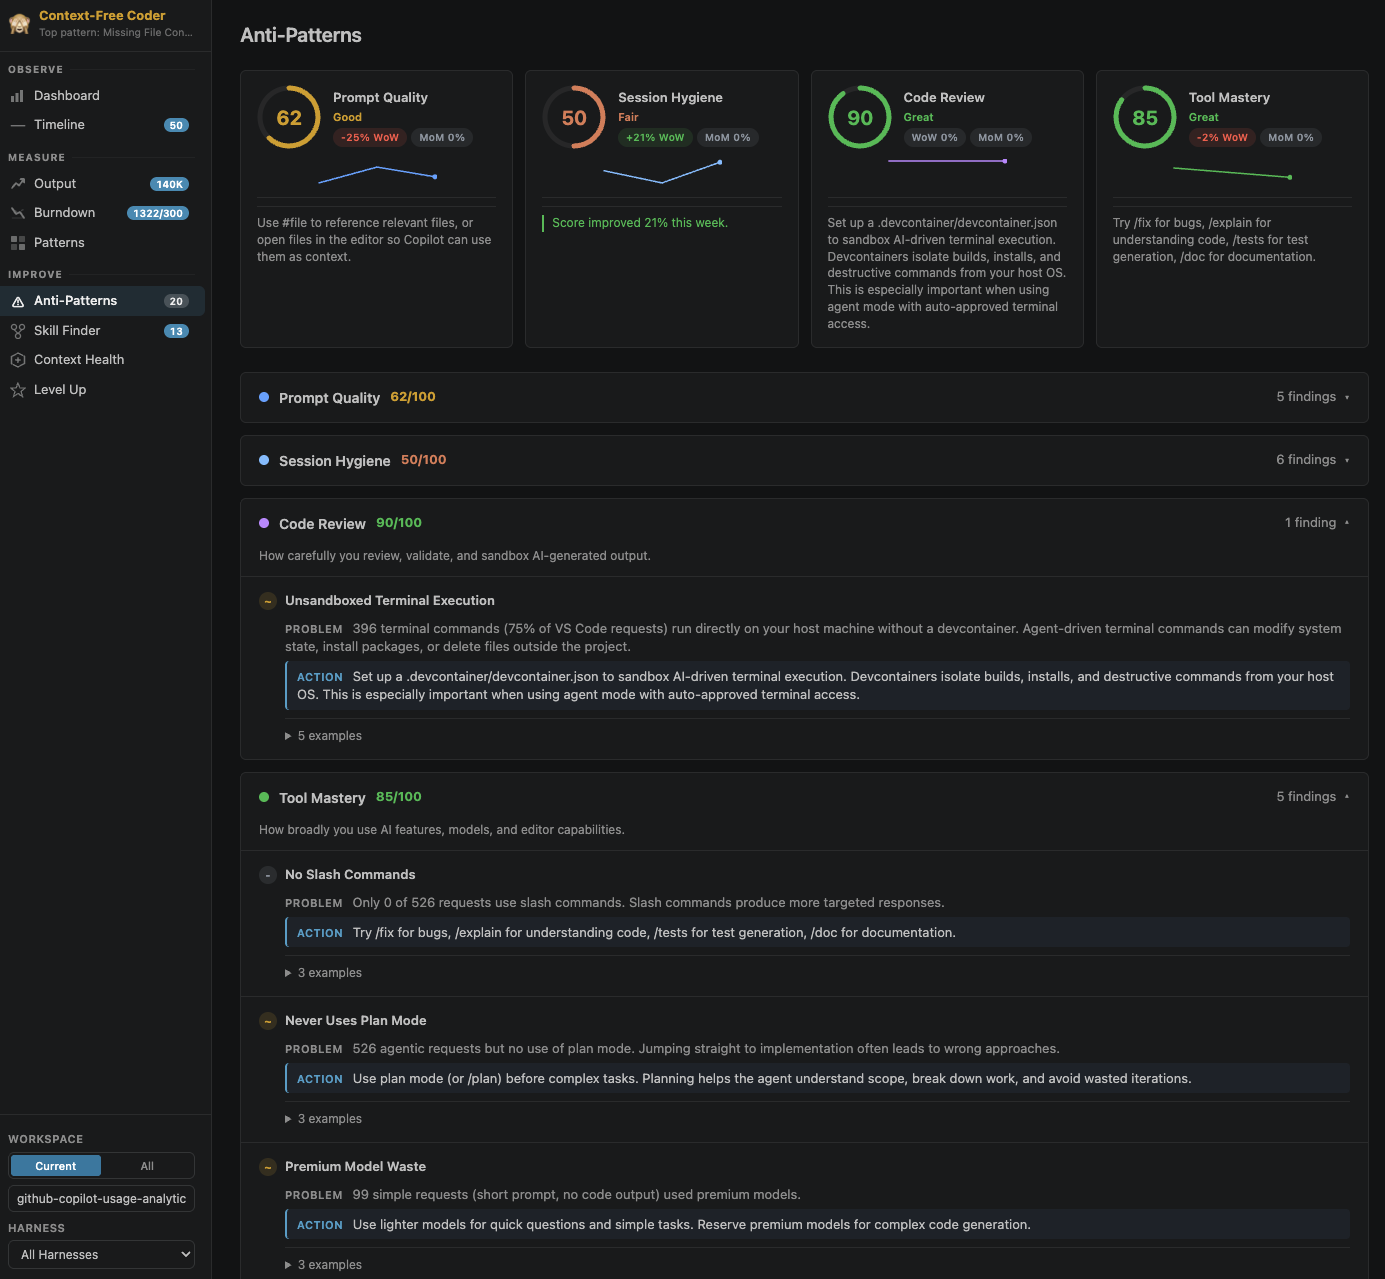
45 editable rules cover prompt quality, session hygiene, review, tooling, and context. A few worth calling out:
- Missing File Context — the 73% from earlier. Open the file or use
#file. - Reasoning Effort Overuse — defaulting to
higheverywhere is slow and expensive. - Verbose Model Output — one line in your custom instructions kills most essay responses.
- Caps Lock Rage — if the prompt is shouting, encode the annoyance into an instruction file instead.
Every rule is a markdown file with a small DSL, so you can edit them per workspace and share them with your team. The Skill Finder clusters prompts you keep retyping and suggests skills to write or pull from awesome-copilot. Context Health scores your workspace setup (instructions, agents, prompts, devcontainers, MCP) and approximates how often you hit auto-compactions.
Privacy
The extension is read-only and does not modify your session files. All parsing happens locally and nothing is sent over the network. There is no telemetry. A handful of features (skill generation, rule compilation, context review) call the VS Code Copilot language model API, but only when you explicitly trigger them.
Try it
git clone https://github.com/microsoft/ai-engineering-coach.git
cd ai-engineering-coach
npm install
npm run package
code --install-extension ai-engineer-coach-*.vsix
Then click the chart icon that shows up in the activity bar on the left edge of the VS Code window.
If you try it, I would genuinely be curious what your numbers look like. Mine were not what I expected. The repo is here, and contributions are welcome.
