Profiling applications can be a difficult and time-consuming process, but it is essential for understanding how an application is performing and where potential bottlenecks may exist.
During Microsoft Ignite, a new feature within Application Insight was announced, which aims to make collecting profiling information for java applications much easier.
Accessing the Profiler Feature
To access the feature, navigate to the “Performance” section within Application insight. Next click on the “Profiler” button.
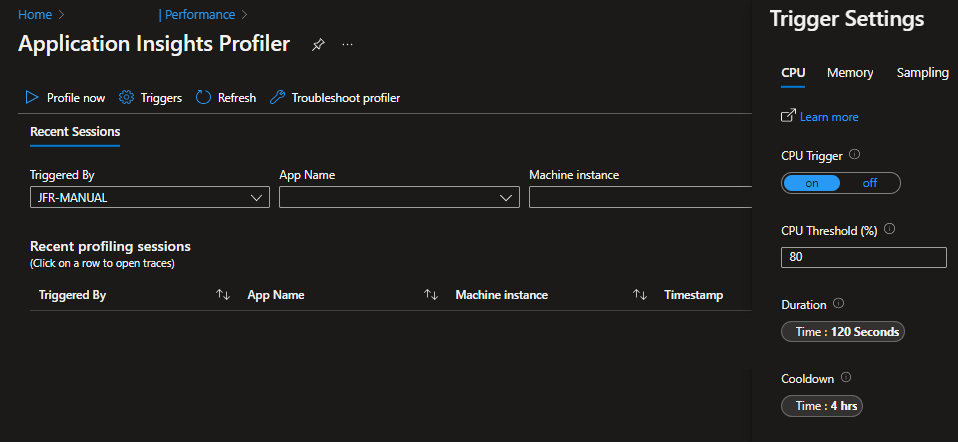
Setting Up Automatic Profiling
Within this view, you can setup automatic collection of profiling information by a specific CPU or Memory Threshold. This can be very valuable when some strange behaviour is observed exclusively in production during specific time periods, or when trying to track down why an application is slower during certain times of day. You can also manually start a profiling session directly through the portal.
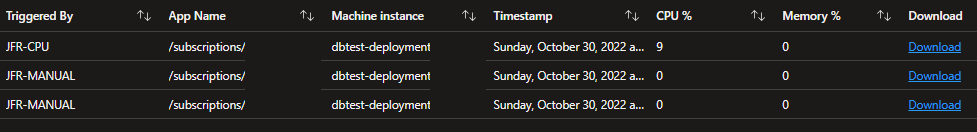
Analyzing Profiling Data
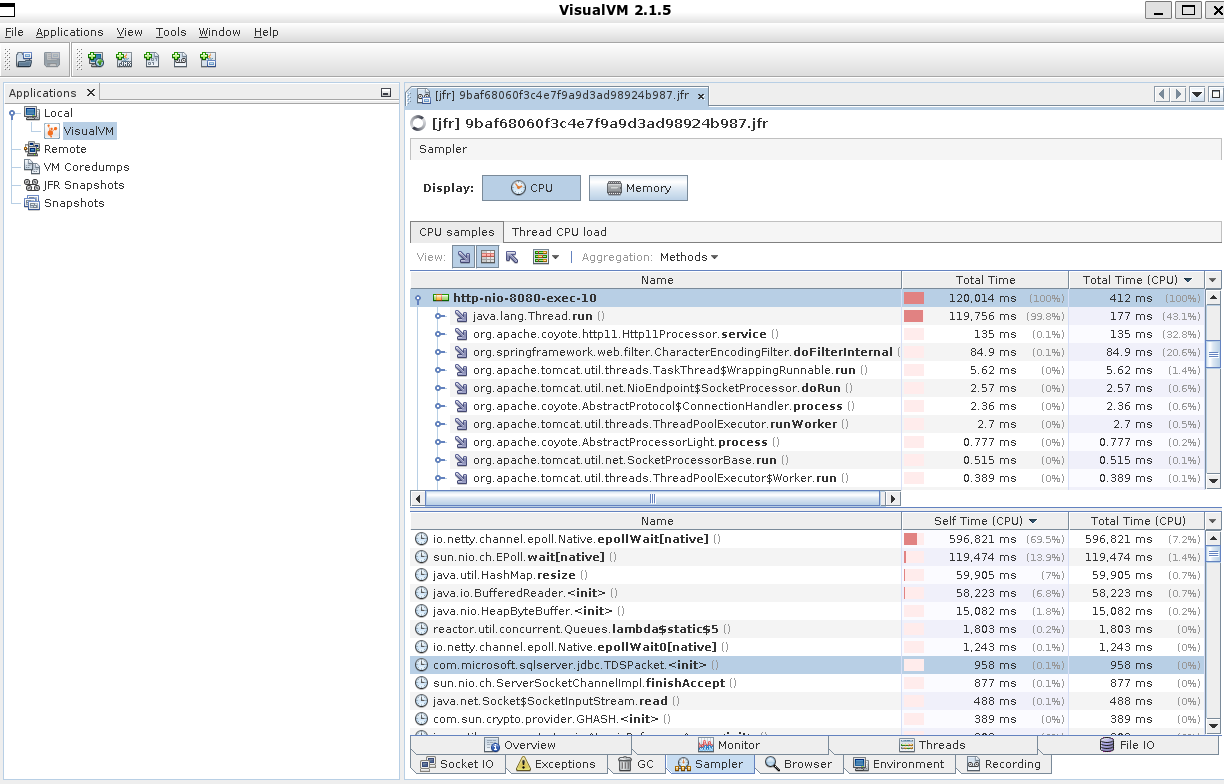
Once Application Insight has collected profiling data, you can download a JFR file for further analysis. One of the tools available is VisualVM. Now you can drill-down to identify what methods are taking the longest to execute:
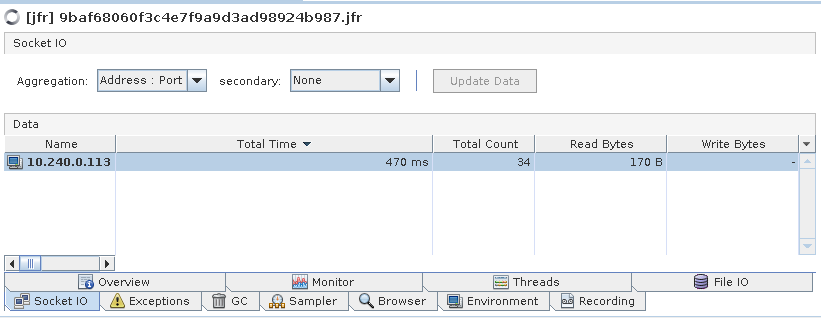
The data can also be used to get a better understanding about the Socket IO activity:
Prerequisites
To use this preview feature, you’ll have to meet the following prerequisites:
- Use Application Insights Agent version 3.4.1 or higher
- Use Java 8 update 262+ or Java 11+
- Opting-in to this preview feature by setting the env variable
APPLICATIONINSIGHTS_PREVIEW_PROFILER_ENABLED=true
Further Reading
For more information on how to use this new feature, please check out the following documentation: Java Profiler for Azure Monitor Application Insights — Azure Monitor | Microsoft Learn
Conclusion
The new Java profiler feature in Application Insights makes it significantly easier to collect and analyze performance data from Java applications. By enabling automatic profiling based on thresholds, developers can capture performance issues as they occur in production environments without manual intervention. This proactive approach to performance monitoring can help identify bottlenecks and optimize application performance more effectively.
